Information Graphics are accelerators. Good ones improve the understanding of complex thoughts or systems by illustrating patterns, trends, and pathways between ideas in clear, thoughtful way. Information Graphics capitalize on the human ability to recognize patterns and trends.
BlueCozmos’s experience is in the creation of using principles of visual communication design to illustrate models or concept of information architecture. In all, BC uses a “general to specific” approach to design. In the case of sitemaps, pathways to information become more and more precise as the viewer progresses to the page requiring decisive interaction. We strive to clarify how a website, road system or set of data points relate not only to each other but a more significant concept.
Information graphics are useful tools. BlueCozmos uses them daily to:
Chart the contents of a brochure or sales package
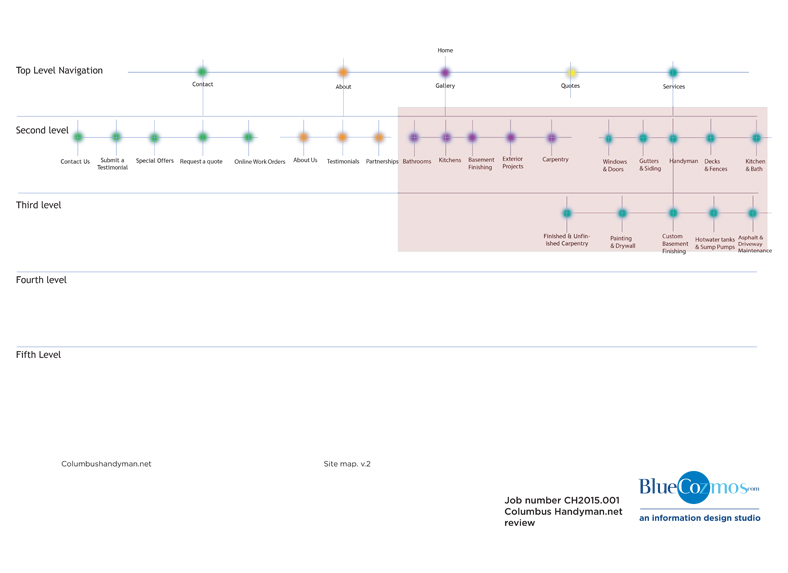
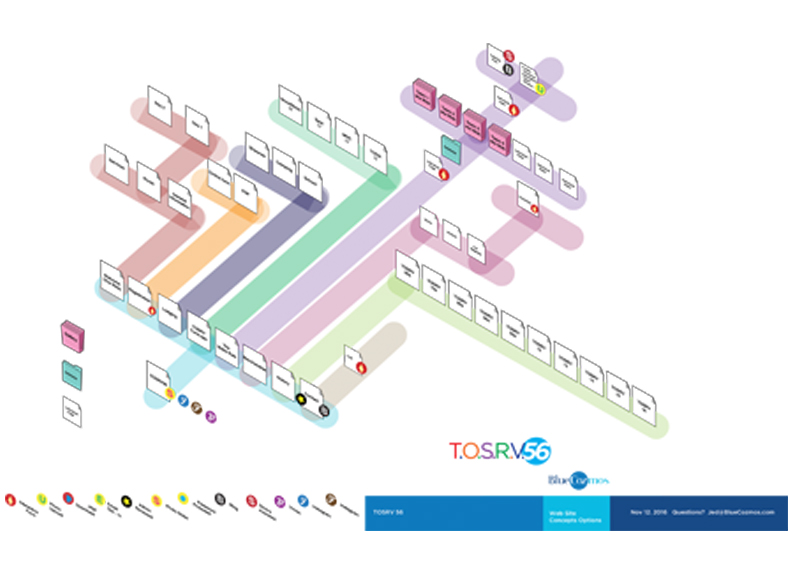
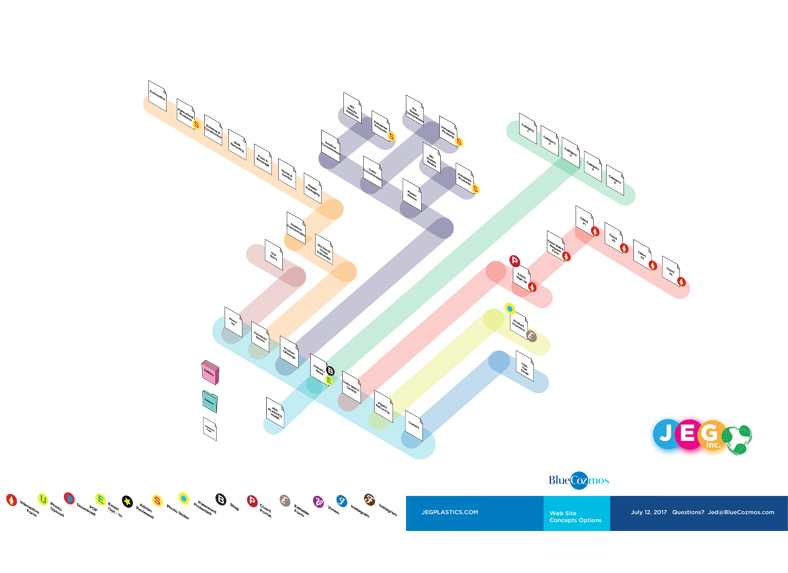
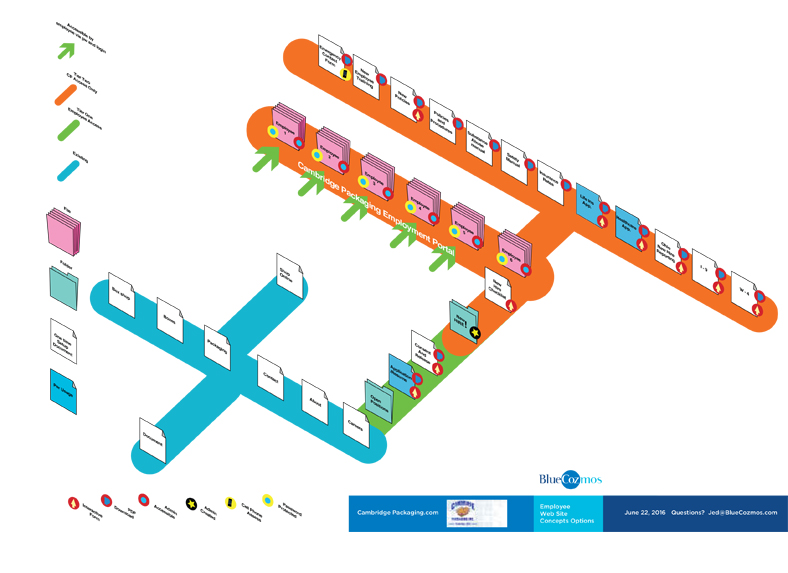
Design the navigation of a sophisticated website
Illustrate the amount of development needed on any site
Create a roadmap to show economic development zones for a city.
Information graphics can be used to convey a lot of information in a minimal space.